More info to come when the brackets are released next week.
Teams per region with a qualifier (68 out of 119 total teams)
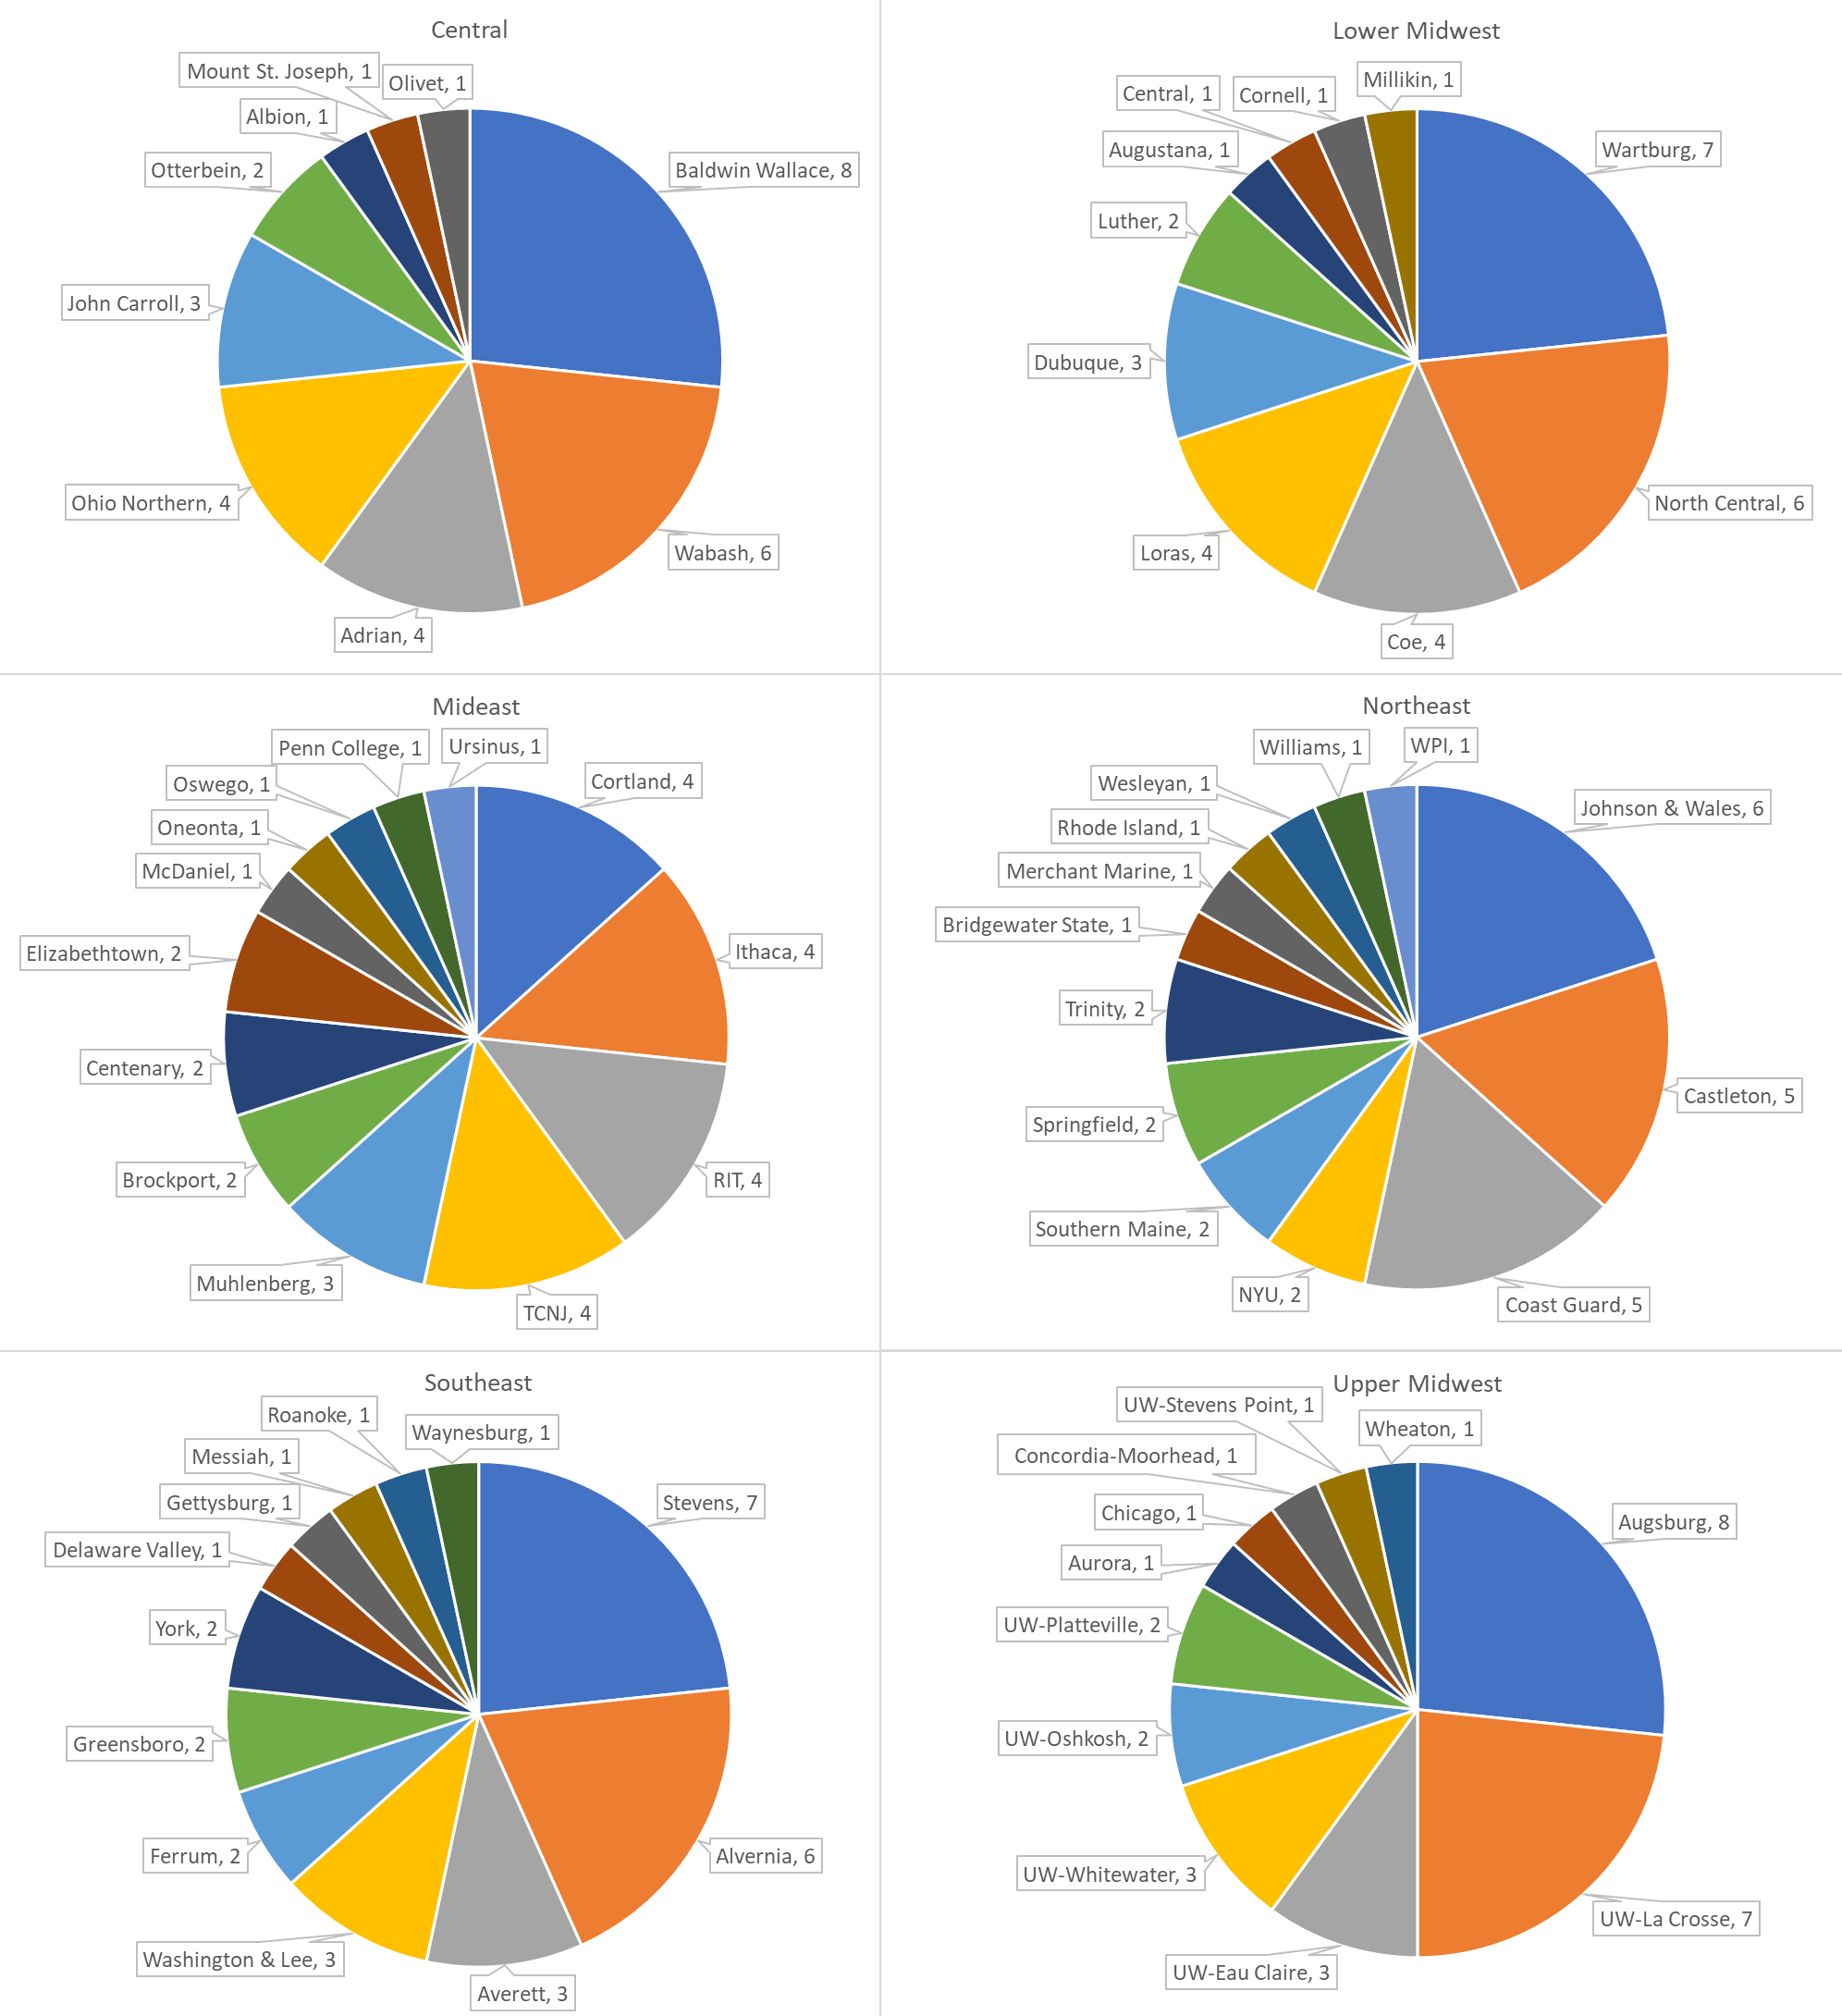
Lower Midwest – 10 of 19 (180 individual entries)
Upper Midwest – 11 of 19 (169 entries)
Central – 9 of 20 (184 entries)
Mideast – 13 of 21 (192 entries)
Northeast – 13 of 19 (177 entries)
Southeast – 12 of 21 (193 entries)
180 of 1,095 regional entries qualified (16.4%)
1,066 regional entries in 2022 (+29 in 2023)
Click image below for regional breakdown
Number seeded by region
Lower Midwest – 18
Upper Midwest – 16
Central – 14
Southeast – 11
Northeast – 11
Mideast – 10
Seed Breakdown by Region
| Region↓/Seed→ | 1st | 2nd | 3rd | 4th | 5th | 6th | 7th | 8th |
| Central | 2 | 4 | 2 | 2 | 0 | 0 | 1 | 3 |
| Lower Midwest | 3 | 3 | 2 | 2 | 4 | 2 | 1 | 1 |
| Mideast | 0 | 0 | 1 | 1 | 2 | 3 | 1 | 2 |
| Northeast | 4 | 1 | 1 | 0 | 1 | 1 | 1 | 2 |
| Southeast | 0 | 1 | 1 | 2 | 2 | 2 | 2 | 1 |
| Upper Midwest | 1 | 1 | 3 | 3 | 1 | 2 | 4 | 1 |
Relative Seed Strength (8 points for 1st seed down to 1 for 8th)
Lower Midwest – 92
Central – 71
Upper Midwest – 67
Northeast – 56
Southeast – 42
Mideast – 32
Seeded Region Champs – 43
Seeded Region 2nd – 26
Seeded Region 3rd – 11
Non-region champs to be seeded
Lower Midwest – 10 (4 3rd place)
Upper Midwest – 8 (2 3rd place)
Northeast – 5 (2 3rd place)
Southeast – 5 (2 3rd place)
Central – 4 (1 3rd place)
Mideast – 3
Unseeded Region Champs – 17 total
Northeast – 4
Southeast – 4
Mideast – 3
Central – 2
Lower Midwest – 2
Upper Midwest – 2


